
Page 57 - Informe Estadistico
P. 57
INSTITUTO NACIONAL PENITENCIARIO INFORME ESTADÍSTICO
UNIDAD DE ESTADÍSTICA SETIEMBRE - 2013
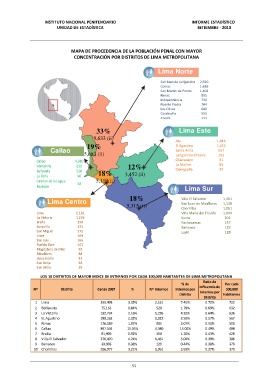
MAPA DE PROCEDENCIA DE LA POBLACIÓN PENAL CON MAYOR
CONCENTRACIÓN POR DISTRITOS DE LIMA METROPOLITANA
Lima Norte
San Juan de Lurigancho 2,920
Comas 1,636
San Martin de Porres 1,402
Rimac 895
Independencia 730
Puente Piedra 704
Los Olivos 680
Carabayllo 555
Ancon 111
33% Lima Este
9,633 (ii) Ate 1,416
19% El Agustino 1,022
Callao Santa Anita 657
5,683 (ii) Lurigancho-Chosica 152
Callao 4,380 Chaclacayo 91
Ventanilla 628 12% La Molina 85
Bellavista 520 18% Cieneguilla 29
La Perla 96 3,452 (ii)
Carmen de la Legua- 5,119(ii)
58
Reynoso
Lima Sur
18% Villa El Salvador 1,461
Lima Centro
5,315 (ii) San Juan de Miraflores 1,148
Chorrillos 1,061
Lima 2,161 Villa Maria del Triunfo 1,049
La Victoria 1,226 Surco 201
Breña 350 Pachacamac 137
Surquillo 321 Barranco 129
San Miguel 272 Lurin 128
Lince 169
San Luis 166
Pueblo libre 102
Magdalena del Mar 93
Miraflores 88
Jesus maria 82
San Borja 58
San Isidro 29
LOS 10 DISTRITOS DE MAYOR INDICE DE INTERNOS POR CADA 100,000 HABITANTES DE LIMA METROPOLITANA
Ratio de
% de Por cada
Influencia de
Nº Distrito Censo 2007 % Nº Internos Internos por 100,000
Internos por
Distrito habitantes
Distrito
1 Lima 299,493 3.35% 2,161 7.40% 0.72% 722
2 Bellavista 75,163 0.84% 520 1.78% 0.69% 692
3 La Victoria 192,724 2.16% 1,226 4.20% 0.64% 636
4 EL Agustino 180,262 2.02% 1,022 3.50% 0.57% 567
5 Rimac 176,169 1.97% 895 3.07% 0.51% 508
6 Callao 897,144 10.05% 4,380 15.00% 0.49% 488
7 Breña 81,909 0.92% 350 1.20% 0.43% 428
8 Villa El Salvador 378,470 4.24% 1,461 5.00% 0.39% 386
9 Barranco 33,903 0.38% 129 0.44% 0.38% 379
10 Chorrillos 286,977 3.21% 1,061 3.63% 0.37% 370
55