
Page 45 - Informe Estadistico
P. 45
INSTITUTO NACIONAL PENITENCIARIO INFORME ESTADÍSTICO
UNIDAD DE ESTADÍSTICA FEBRERO - 2013
POBLACIÓN PENAL POR NIVELES DE INSTRUCCIÓN
SEGÚN OFICINAS REGIONALES
PRIMARIA SECUNDARIA SUPERIOR NO UNIV SUPERIOR UNIV
OFICINAS REGIONALES ANALFABETO
INCOMP. COMP. INCOMP. COMP. INCOMP. COMP. INCOMP. COMP.
TOTAL GENERAL 1,226 9,189 5,419 22,576 18,136 1,629 1,650 1,204 1,130
O.R.NORTE - CHICLAYO 295 2,022 1,002 2,848 2,288 233 221 128 146
O.R.LIMA - LIMA 340 3,198 1,985 14,206 10,554 925 855 691 627
O.R.SUR - AREQUIPA 33 379 117 723 878 70 85 62 54
O.R.CENTRO - HUANCAYO 164 1,012 674 1,448 1,383 160 135 75 111
O.R.ORIENTE - HUANUCO 142 920 334 1,148 951 80 107 43 56
O.R.SUR ORIENTE - CUSCO 62 577 364 863 876 78 75 120 56
O.R.NOR ORIENTE - SAN MARTIN 157 769 807 945 696 44 122 36 42
O.R.ALTIPLANO - PUNO 33 312 136 395 510 39 50 49 38
Fuente: Unidades de Registro Penitenciario
Elaboración: INPE/Unidad de Estadística
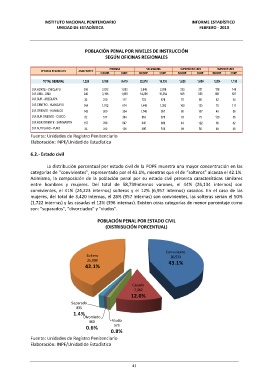
6.2.- Estado civil
La distribución porcentual por estado civil de la POPE muestra una mayor concentración en las
categorías de “convivientes”, representado por el 43.1%, mientras que el de “solteros” alcanza el 42.1%.
Asimismo, la composición de la población penal por su estado civil presenta características similares
entre hombres y mujeres. Del total de 58,739internos varones, el 44% (26,134 internos) son
convivientes, el 41% (24,223 internos) solteros y el 12% (6,957 internos) casados. En el caso de las
mujeres, del total de 3,420 internas, el 28% (957 internas) son convivientes, las solteras serían el 50%
(1,722 internas) y las casadas el 12% (396 internas). Existen otras categorías de menor porcentaje como
son: “separados”, “divorciados” y “viudos”.
POBLACIÓN PENAL POR ESTADO CIVIL
(DISTRIBUCIÓN PORCENTUAL)
Conviviente
Soltero 26,533
25,909 43.1%
42.1%
Casado
7,382
12.0%
Separado
835
1.4%
Divorciado
360 Viudo
573
0.6%
0.8%
Fuente: Unidades de Registro Penitenciario
Elaboración: INPE/Unidad de Estadística
43